Every 10 years, the National Oceanic Atmospheric Administration analyzes data from its thousands of weather stations and releases new climate “normals,” providing temperature touchstones for any given day or month of the year.
NOAA’s latest batch of data came out Tuesday. The data shows how Southcentral Alaska, and the country as a whole, is heating up.
Brian Brettschneider is a research physical scientist with the National Weather Service Alaska Region. He’s been looking at the new data for a while. It’s a lot of information.
“My computer is — basically, smoke is coming out of it. I’m trying to crunch some numbers,” Brettschneider said.
The agency comes up with what are, in a sense, 30-year averages. And the data comes from 250 weather stations in Alaska that collect daily observations.
Some stations are managed by the Federal Aviation Administration, like the one near the Kenai Municipal Airport. But most data around the state is collected by citizen observers.
Taken together, that data provides a sort of climatic census. The last one covered the three decades between 1981 and 2010. This one spans 1991 to 2020. That means there’s 20 years of overlap between the data sets.
“In a sense, what we’re doing is we’re dropping out the 1980s and we’re adding in the 2010s,” Brettschneider said.
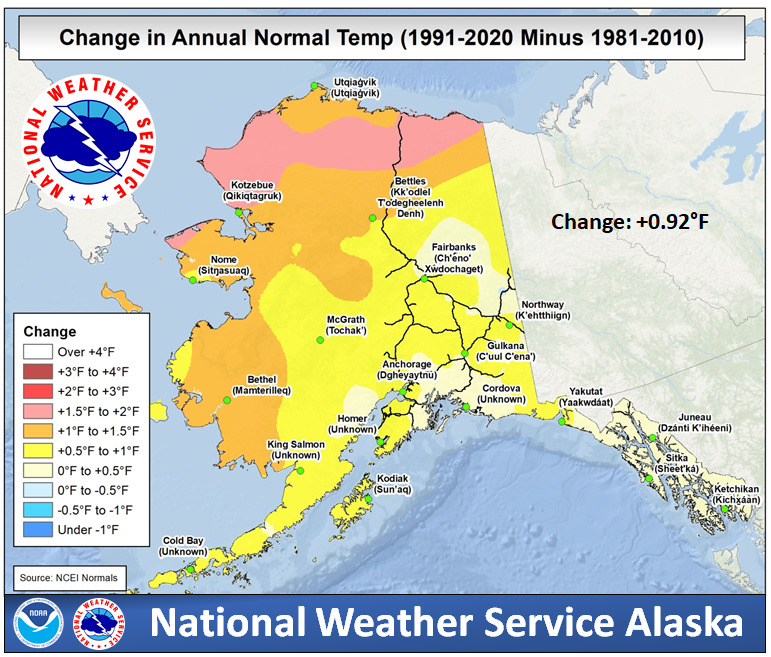
The new numbers highlight a trend of rising temperatures in Alaska and the U.S. as a whole.
For much of Southcentral Alaska, including the Kenai, Homer and Anchorage areas, the change in annual normal temperature is between a half degree to a degree.
Brettschneider said disparities between new and old average temperatures are smaller in Southeast Alaska. In Western Alaska and above the Arctic Circle, they’re larger.
In Fairbanks, a change in average temperature during one month of the year will trigger a change in how the region’s classified. As climate specialist Rick Thoman pointed out on Twitter, the average temperature for May changed from a hair below 50 degrees by the last measure to a hair over this time around. That means the region is technically reclassified from a “sub-Arctic climate” to a “warm summer continental” climate under what’s known as the Köppen classification.
It’s in part a semantic change, but Brettschneider said it’s noteworthy.
“We would expect that there’s going to be any number of stations that incrementally move from one climate zone to the next,” he said. “And again, you don’t necessarily feel incremental changes. But incremental changes are changes nonetheless. And the next time around, more stations will have that incremental change.”
He said even seemingly small differences in temperature are significant because many parts of Alaska teeter on the edge of freezing for much of the year.
“And major things happen once we move from one side of that line to another,” Brettschneider said.
The new data accounts for changes in precipitation, too. But that change is more difficult to gauge, Brettschneider said, because there’s so much variability year to year.
But he said there does seem to be an overall increase in precipitation. That’s generally expected with a warming climate because warmer air can hold more moisture.
You can find the new normals here.